Getting Started with Microsoft Sentinel- Use Overview Dashboard and Workbooks To Get Visibility Across Enterprise

Get Visualization
The overview dashboard gives an idea of the security posture of an organization. Incidents are a group of related alerts that are used to create an actionable incident to investigate and resolve. In Microsoft Sentinel a desired workspace can be selected to monitor.
View Incident Data

- There are various types of incident data under Incidents.
- The top left contains the number of new, active, and closed incidents of the last 24 hours.
- The right left contains the incidents according to severity, and closed incidents by closing classification.
- There is a graph at the bottom left that breaks up the incident status by creation time in 4 hour intervals.
- The bottom right consists of the mean time that acknowledges an incident and mean time to close with a link to the SOC efficiency workbook.
View Automation Data

- There are various types of automation data under Automation.
- At the top, there is a summary of the automation rules activity, like- Incidents closed by automation, the time the automation saved, and related playbooks health.
- Under the summary, there is a graph that summarizes the numbers of actions done by automation, by type of action.
- At the bottom, the active number of automation rules are available with automation blade.
View Status of Data Records, Data Collectors, and Threat Intelligence

- There are various types of data on data records, data collectors, and threat intelligence under Data.
- The graph on the left showcase the number of records collected in the last 24 hours as compared to the previous 24 hours along with the anomalies detected in that time period.
- The top right depicts the summary of the data connector status, divided by unhealthy and active connectors. Unhealthy connectors indicates the number of connectors with errors, while Active connectors contains Microsoft Sentinel's data streaming, as measured by a query included in the connector.
- The bottom right contains threat intelligence records in Microsoft Sentinel, by indicator of compromise.
View Analytics Data
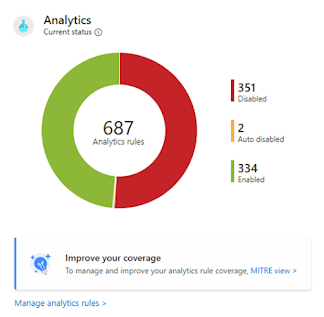
There are various analytics rules under Analytics in Microsoft Sentinel by enabled, disabled, or auto-disabled status.
Use Workbooks Templates
They offers integrated data from the connector data sources and allows to learn more about the events generated in those services. There is a wide variety of workbook templates like Azure AD, Azure activity events, etc. They rely on Azure Monitor Workbooks to provide enhanced customizability and flexibility in designing a workbook.
- Go to Settings and choose Workbooks. My Workbooks contains all the saved workbooks and Templates contains all the installed workbook templates. You can also go to Content hub to look for more workbook templates.
- Search for the required workbook and read the whole list and description.
- However, it is recommended to install Azure AD solution for Microsoft Sentinel and use following workbooks:
- Azure AD- Use either or both of the following-
- Azure AD sign-ins, which analyzes the sign-ins to look for any anomalies. They provide failed sign-ins by applications, devices, and locations to catch anything unusual with more focus on the multiple failed sign-ins.
- Azure AD Audit Logs, analyzes admin activities like changes in number of users, group creation, and modifications.
- An appropriate solution can be installed to add a workbook for your firewall. Workbooks analyzes the firewall traffic and offer details about the correlation between the firewall data and threat events while also throwing light on the suspicious activities. They can also provide information about traffic trends, to know more and filter results.
The workbooks cam be customized by editing the main query.


Comments
Post a Comment