Azure Monitor - Log Analytics (part 3 of 4)
Enabling Azure Sentinel
- If Azure Sentinel is not enabled for your tenant, then you have to sign in to Azure portal, enter Azure Sentinel in the search box, and select the Azure Sentinel entry.
- Click the Add button for an extra workspace.
- You can easily choose an appropriate workspace from the list provided or click Create a new workspace to add a new workspace and then select it. Now you can click Add Azure Sentinel button at the bottom of the screen to continue further.
- After creating a new workspace, the News & guide page of Azure Sentinel will provide some easy steps to set up the workspace.
Now, you have successfully created your Azure Sentinel environment and ready to use it.
Exploring the Azure Sentinel Overview page
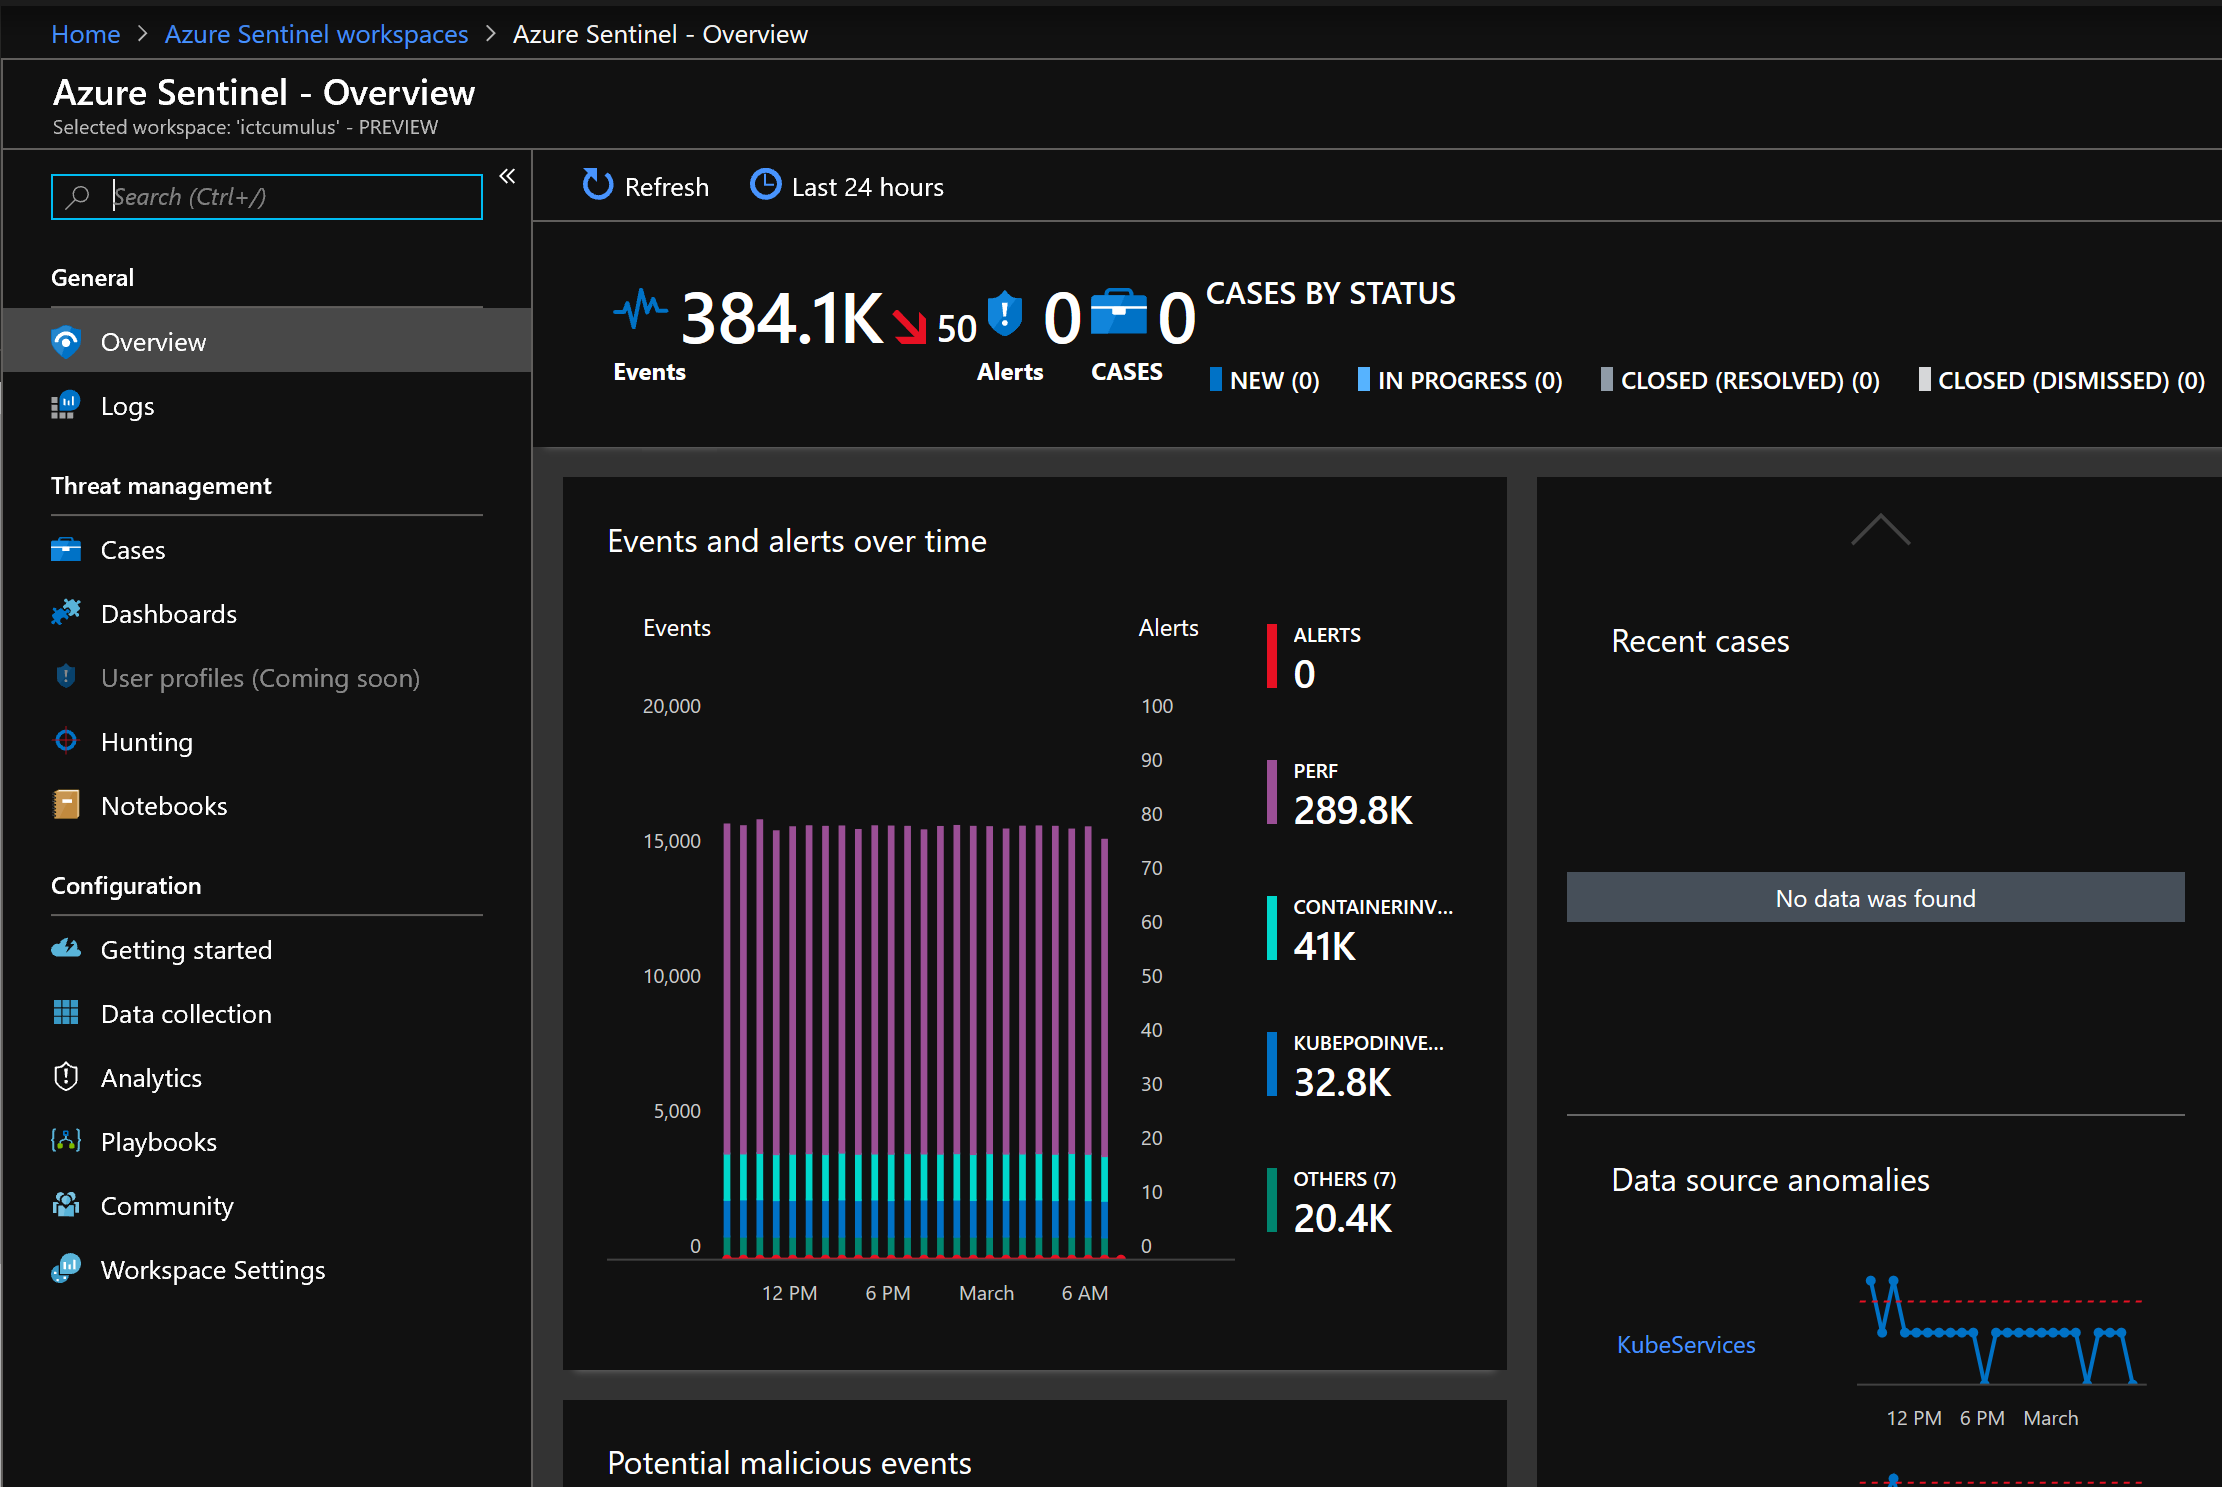
The page's different sections are described below:
- The header bar
It helps you to refresh the screen to see any updates and choose how far back in time to look for data by selecting a clock like looking icon.
- The summary bar
It will show you the amount of data being ingested, alerts raised, and the number of incidents those alerts have created in a particular time period along with the incidents broken down by their status.
- The events & alerts over time section
It will allow to see the logs responsible for ingesting the most data and the number of incidents created in a particular time frame. Due to this section's interactive nature, whenever you select a specific time, it will automatically show you the filtered information about anything happened in that time period.
- The recent incident section
It will show the last five incidents created as well as the number of alerts responsible for generating those incidents. You can get more information about any incident by simply clicking on its name.
- The data source anomalies section
The two different data sources that Azure Sentinel's Machine Learning has recognized as anomalies can be seen in this section and by simply clicking on the log name, you can get more details about the anomaly.
- The potential malicious events section
Although this section is not visible, it can highlight you any potential malicious events with the help of an interactive map and you can just zoom in get precise indication of the occurrence of the event.
- The democratize ML for your SecOps section
Another invisible section which is capable of providing you with the general knowledge on Azure Sentinel's Machine Learning as well as a link for more information.
The Azure Sentinel's Overview page is a great place to get an overview of your Azure Sentinel's environment.


Comments
Post a Comment