Manage Security Operations (part 1 of 3)
Azure Monitor
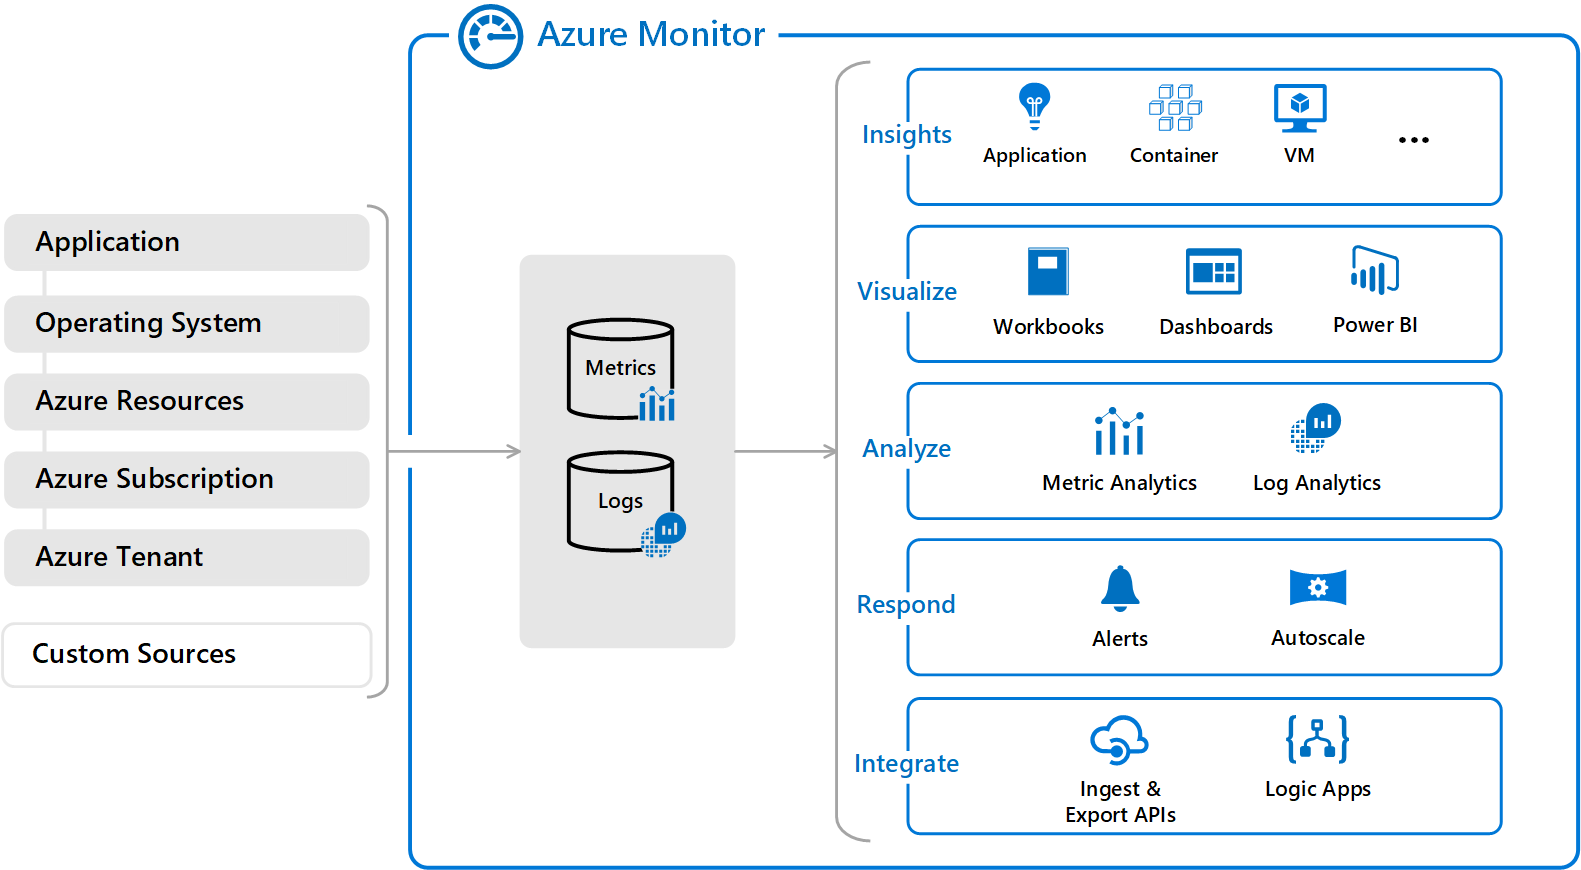
The following high-level diagram depicts the two fundamental data types that Azure Monitor uses, Metrics and Logs.
On the left side of the figure are the sources of monitoring data that populate these data stores, while on the right side are the different functions that Azure Monitor performs with this collected data, like analysis, alerting, and streaming to external systems.
For many Azure resources, you can find the data that Azure Monitor collects right in the resource's overview page in the Azure portal while the several charts displaying performance metrics can be noticed in any virtual machine (VM), you can select any of the graphs to open the data in Metrics Explorer, which allows you to chart the values of the multiple metrics over time.
You can analyze log data that Azure monitor collects by using queries to quickly retrieve, consolidate, and analyze the collected data while also creating and testing the queries by using log analytics in the Azure portal and then either directly analyze the data by using these tools or save queries for use with visualizations or alert rules.
Exporting data to SIEM
Azure Security Center security alerts
Security Center displays a list of prioritize security alerts along with the information you need to quickly investigate the problem and recommendations for how to remediate an attack and automatically collects, analyzes, and integrates log data from your Azure resources; the network; and connected partner solutions, like firewall and endpoint protection solutions, to detect real threats and reduce false positives.
Azure Event Hubs
It is a streaming platform and event ingestion service that can transform and store data by using any real-time analytics provider or batching/storage adapters. You can also use the Event Hubs to stream log data from Azure Monitor to an Azure Sentinel or a partner SIEM and monitoring tools.
What data can be sent into an event hub?
Within your Azure environment, there are several 'tiers' of monitoring data, these can be described as:
- Application monitoring data- Data about the performance and functionality of the code you have written and are running on Azure. Application monitoring data is usually collected in one of the given ways- by instrumenting your code with an SDK such as the Applications Insights SDK, or, by running a monitoring agent that listens for new application logs on the machine running your application, such as the Windows Azure Diagnostic Agent or Linux Azure Diagnostic Agent.
- Guest OS monitoring data- Data about the operating system on which your application is running. To collect this type of data, you need to install an agent such as the Windows Azure Diagnostic Agent or Linux Azure Diagnostic Agent.
- Azure resource monitoring data- Data about the operation of an Azure resource. For some Azure resource types, such as virtual machines, there is a guest OS and application(s) to monitor inside of that Azure service. For other Azure resources, such as Network Security Groups, the resource monitoring data is the highest tier of data available. This data can be collected using resource diagnostic settings.
- Azure subscription monitoring data- Data about the operation and management of an Azure subscription, as well as data about the health and operation of Azure itself. The activity log contains the most subscription monitoring data, such as service health incidents and Azure Resource Manager audits. You can collect this data using a Log Profile.
- Azure tenant monitoring data- Data about the operation of tenant-level Azure services, such as Azure AD whose audits and sign-ins are examples of tenant monitoring data. This data can be collected using a tenant diagnostic setting.
Some sources can be configured to send data directly to an event hub while another process such as a Logic App may be required to retrieve the required data.
Connecting to Azure Sentinel
Azure Sentinel brings together the power of Azure and AI to enable Security Operations Centers to achieve more. Some of the features of Azure Sentinel are:
- More than 100 built-in alert rules
1. Sentinel's alert rule wizard to create your own.
2. Alerts can be triggered by a single event or based on a threshold, or by correlating different datasets or by using built-in machine learning algorithms.
- Jupyter Notebooks that use a growing collection of hunting queries, exploratory queries, and python libraries.
- Investigation graph for visualizing and traversing the connections between entities like users, assets, applications, or URLs and related activities like logins, data transfers, or application usage to rapidly understand the scope as well as impact of an incident.
To on-board Azure Sentinel, you first need to enable Azure Sentinel, and then connect your data sources which comes with a number of connectors with Microsoft solutions, available out of the box and providing real-time integration, including Microsoft Threat Protection solutions, Microsoft 365 sources, including Microsoft 365, Azure AD, Azure ATP, as well as Microsoft Cloud App security, and more.
After you connect your data sources, you can choose from a gallery of expertly created dashboards that surface insights based on your data. These dashboards can be easily customize to your needs.


Comments
Post a Comment